Measurements
Track weight, waist, abdomen, chest, arms, legs, blood pressure, resting heart rate and other values in one timeline.
 VitalGraph
 Learn VitalGraph
VitalGraph turns measurements, goals and connected-device data into trends you can understand and act on.
Track weight, waist, abdomen, chest, arms, legs, blood pressure, resting heart rate and other values in one timeline.
See BMI, waist-to-height ratio, waist-to-hip ratio, FFMI and TMI calculated from your measurements.
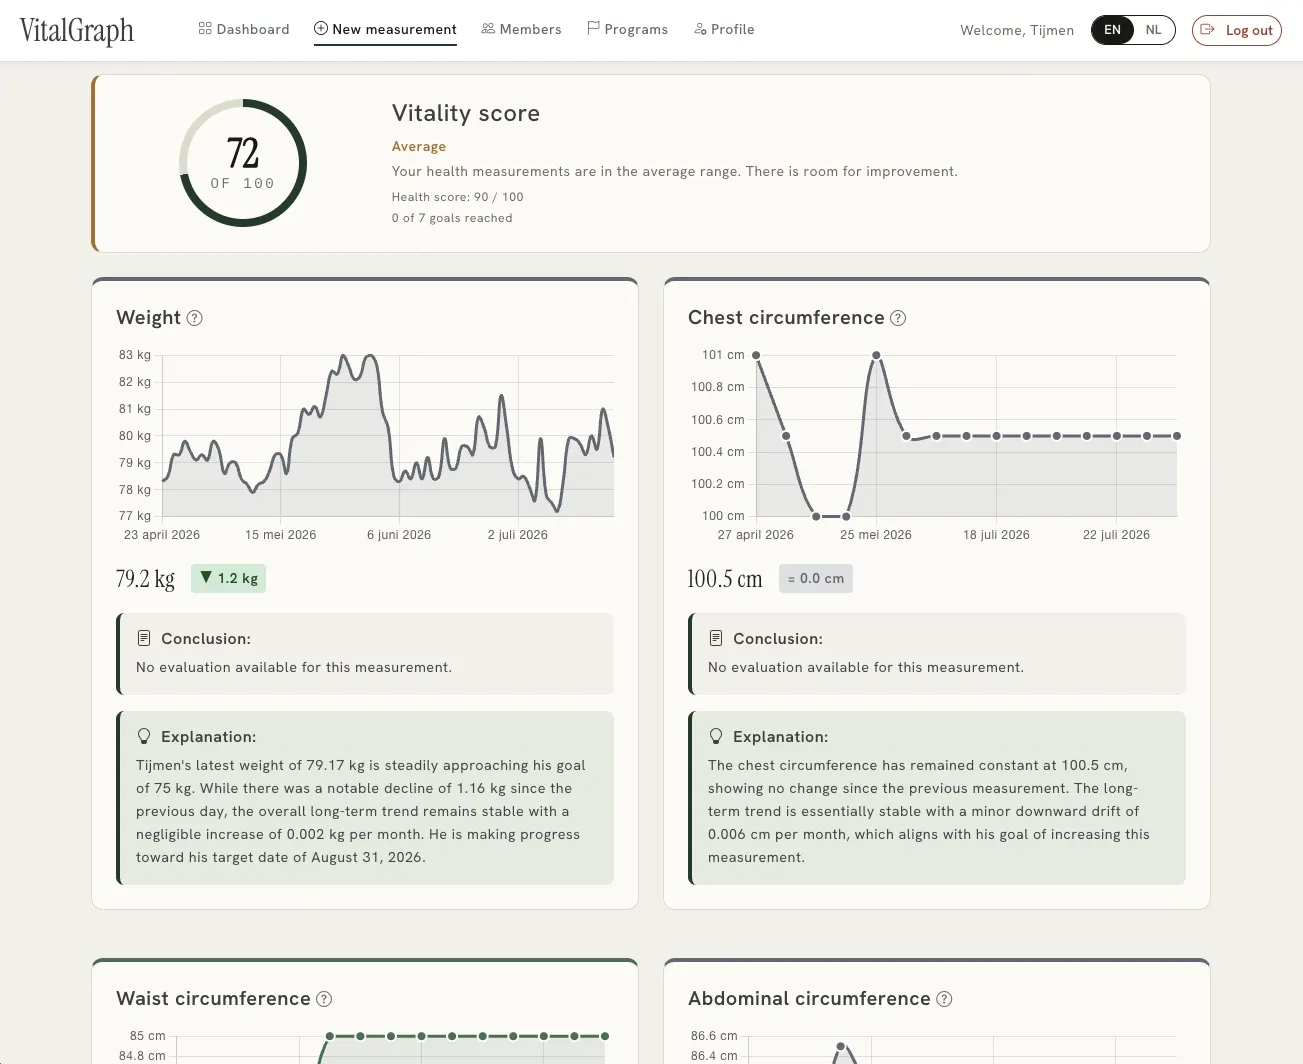
Look beyond one reading. Charts reveal direction, moving averages, healthy ranges and meaningful changes over time.
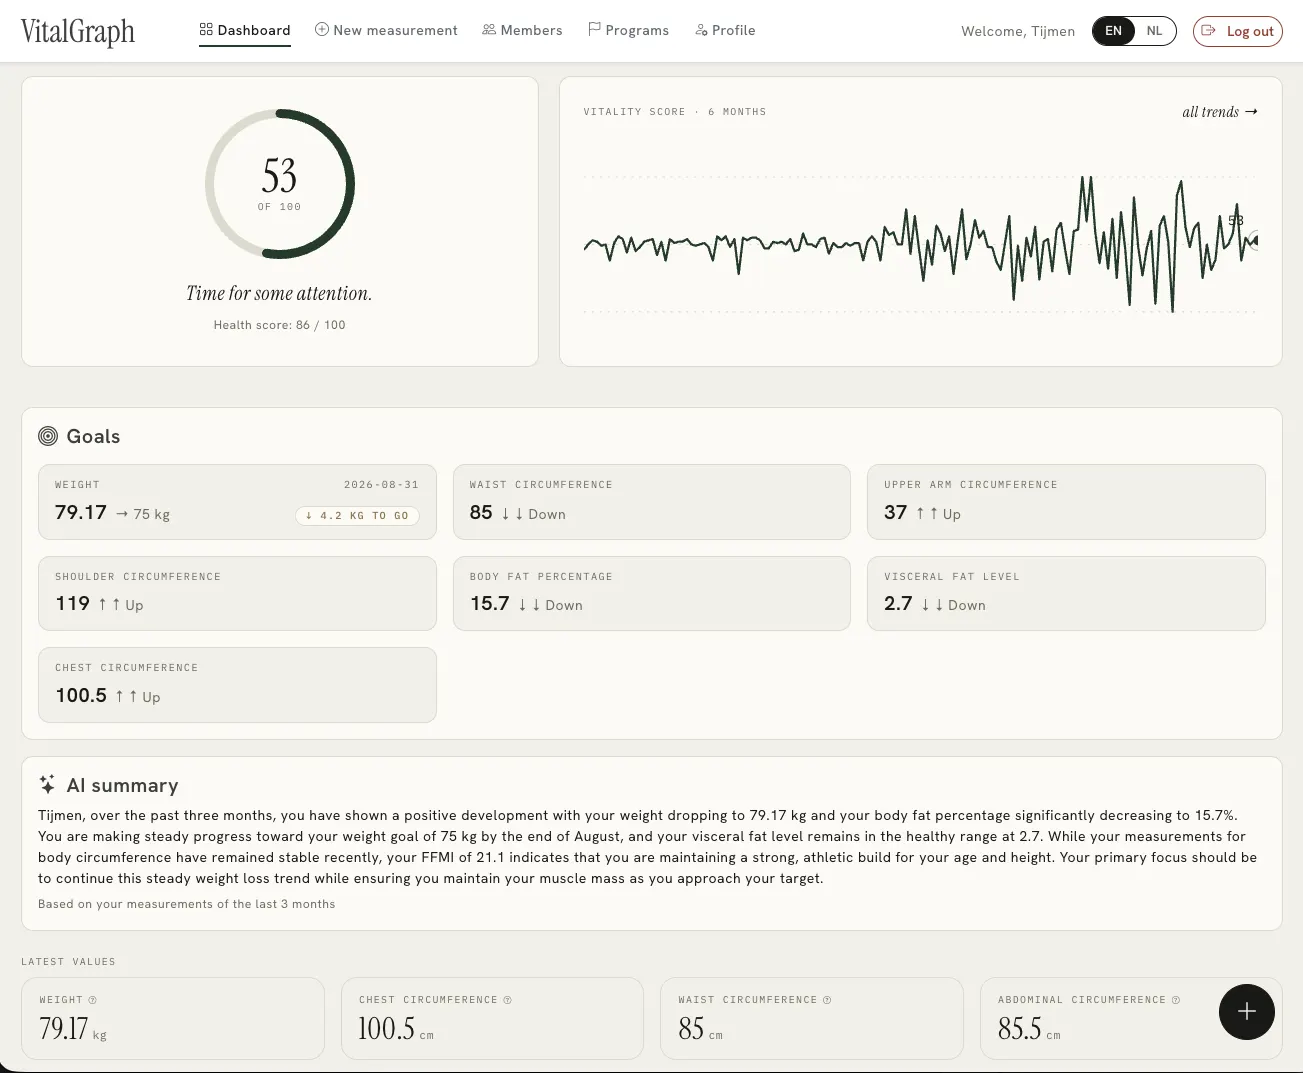
One explainable score summarises current health markers. Every contributing value stays visible.
Set a target, upper limit, lower limit or maintenance range. VitalGraph shows the distance and direction that matter.
Connect supported devices and import historical readings. Existing values remain intact when data overlaps.
Turn a long measurement history into a concise explanation, shareable report or coaching conversation.
Combine measurements, goals and score rules in structured programs for individual or group progress.
Coaches can follow members, review trends and guide progress without losing the member’s own health story.
Choose units, visible attributes and primary metrics. VitalGraph adapts to what you measure—not the other way around.
Timeline
A consistent timeline keeps daily fluctuation in context. Goals and summaries sit beside the source values.
Explainable
A score is a starting point, not a verdict. Open it to see the measurements, trends and explanation behind it.
Add measurements manually or connect a supported source. Your history becomes more useful with every consistent reading.
Start measuring for freeVitalGraph supports self-insight and coaching. It does not replace medical advice.